Running the PhoREAL algorithm over Grand Mesa, CO
Demonstrate running the PhoREAL algorithm in SlideRule to produce canopy metrics over the Grand Mesa, Colorado region.
Imports
[1]:
import logging
import sliderule
from sliderule import icesat2
Initialize Client
[2]:
sliderule.init(verbose=True, loglevel=logging.INFO)
[2]:
True
Processing parameters
[3]:
parms = {
    "poly": sliderule.toregion('grandmesa.geojson')['poly'], # subset to Grand Mesa area of interest
    "t0": '2019-11-14T00:00:00Z', # time range is one day - November 14, 2019
    "t1": '2019-11-15T00:00:00Z',
    "srt": icesat2.SRT_LAND, # use the land surface type for ATL03 photon confidence levels
    "len": 100, # generate statistics over a 100m segment
    "res": 100, # generate statistics every 100m
    "pass_invalid": True, # do not perform any segment-level filtering
    "atl08_class": ["atl08_ground", "atl08_canopy", "atl08_top_of_canopy"], # exclude noise and unclassified photons
    "atl08_fields": ["h_dif_ref"], # include these fields as extra columns in the dataframe
    "phoreal": {"binsize": 1.0, "geoloc": "center"} # run the PhoREAL algorithm
}
Make Proessing Request
[4]:
atl08 = sliderule.run("atl03x", parms)
request <AppServer.61671> retrieved 1 resources
Starting proxy for atl03x to process 1 resource(s) with 1 thread(s)
request <AppServer.62515> on ATL03_20191114034331_07370502_006_01.h5 generated dataframe [gt3r] with 343 rows and 21 columns
request <AppServer.62515> on ATL03_20191114034331_07370502_006_01.h5 generated dataframe [gt3l] with 341 rows and 21 columns
request <AppServer.62515> on ATL03_20191114034331_07370502_006_01.h5 generated dataframe [gt2l] with 351 rows and 21 columns
request <AppServer.62515> on ATL03_20191114034331_07370502_006_01.h5 generated dataframe [gt1l] with 355 rows and 21 columns
request <AppServer.62515> on ATL03_20191114034331_07370502_006_01.h5 generated dataframe [gt2r] with 354 rows and 21 columns
request <AppServer.62515> on ATL03_20191114034331_07370502_006_01.h5 generated dataframe [gt1r] with 357 rows and 21 columns
Successfully completed processing resource [1 out of 1]: ATL03_20191114034331_07370502_006_01.h5
Writing arrow file: /tmp/tmpd6vg4yk5
Closing arrow file: /tmp/tmpd6vg4yk5
Print Resulting GeoDataFrame
[5]:
atl08
[5]:
| h_dif_ref | pflags | region | gt | photon_count | solar_elevation | ground_photon_count | canopy_h_metrics | rgt | h_te_median | ... | x_atc | y_atc | h_max_canopy | h_min_canopy | srcid | vegetation_photon_count | cycle | canopy_openness | photon_start | geometry | |
|---|---|---|---|---|---|---|---|---|---|---|---|---|---|---|---|---|---|---|---|---|---|
| time_ns | |||||||||||||||||||||
| 2019-11-14 03:46:36.981117952 | 5.799881 | 0 | 2 | 30 | 118 | -44.032406 | 20 | [1.5048828, 1.5048828, 1.5048828, 1.5048828, 2... | 737 | 1823.442383 | ... | 4.322300e+06 | 33.324844 | 7.769043 | 0.508423 | 0 | 98 | 5 | 1.399428 | 1069838 | POINT (-108.08651 38.84584) |
| 2019-11-14 03:46:36.995268096 | 6.815710 | 0 | 2 | 30 | 112 | -44.032173 | 24 | [2.0375977, 2.0375977, 2.0375977, 2.0375977, 2... | 737 | 1861.372314 | ... | 4.322400e+06 | 33.237431 | 8.363403 | 1.092041 | 0 | 88 | 5 | 1.633684 | 1069974 | POINT (-108.08663 38.84675) |
| 2019-11-14 03:46:37.009418240 | 5.844150 | 16 | 2 | 30 | 102 | -44.031933 | 102 | [0.0, 0.0, 0.0, 0.0, 0.0, 0.0, 0.0, 0.0, 0.0, ... | 737 | 1893.611084 | ... | 4.322501e+06 | 33.146454 | 0.000000 | 0.000000 | 0 | 0 | 5 | NaN | 1070092 | POINT (-108.08674 38.84765) |
| 2019-11-14 03:46:37.023568128 | 3.316736 | 0 | 2 | 30 | 105 | -44.031689 | 94 | [1.1791992, 1.1791992, 1.1791992, 1.1791992, 1... | 737 | 1898.847656 | ... | 4.322602e+06 | 33.228848 | 1.179199 | 0.519409 | 0 | 11 | 5 | 0.206181 | 1070200 | POINT (-108.08685 38.84855) |
| 2019-11-14 03:46:37.037718016 | -1.645961 | 0 | 2 | 30 | 91 | -44.031452 | 27 | [1.569458, 1.569458, 1.569458, 1.569458, 2.542... | 737 | 1892.505737 | ... | 4.322702e+06 | 33.172836 | 4.684448 | 0.580322 | 0 | 64 | 5 | 0.921298 | 1070306 | POINT (-108.08696 38.84945) |
| ... | ... | ... | ... | ... | ... | ... | ... | ... | ... | ... | ... | ... | ... | ... | ... | ... | ... | ... | ... | ... | ... |
| 2019-11-14 03:46:41.909418240 | -3.708359 | 0 | 2 | 50 | 105 | -43.974560 | 103 | [0.6296387, 0.6296387, 0.6296387, 0.6296387, 0... | 737 | 1728.333130 | ... | 4.357472e+06 | -3154.093750 | 0.629639 | 0.536987 | 5 | 2 | 5 | 0.046326 | 1132271 | POINT (-108.08859 39.16396) |
| 2019-11-14 03:46:41.923518464 | -2.790664 | 0 | 2 | 50 | 95 | -43.974361 | 87 | [0.8251953, 0.8251953, 0.8251953, 0.8251953, 0... | 737 | 1724.484131 | ... | 4.357573e+06 | -3153.931152 | 6.393188 | 0.567627 | 5 | 8 | 5 | 2.033772 | 1132378 | POINT (-108.08870 39.16486) |
| 2019-11-14 03:46:41.937768448 | -2.073942 | 0 | 2 | 50 | 97 | -43.974068 | 79 | [0.81433105, 0.81433105, 0.81433105, 0.8143310... | 737 | 1718.757690 | ... | 4.357674e+06 | -3154.187988 | 7.938599 | 0.540161 | 5 | 18 | 5 | 2.606790 | 1132482 | POINT (-108.08881 39.16577) |
| 2019-11-14 03:46:41.952018432 | -1.922682 | 0 | 2 | 50 | 103 | -43.973827 | 93 | [1.4121094, 1.4121094, 1.4121094, 1.4121094, 1... | 737 | 1713.514893 | ... | 4.357775e+06 | -3154.338867 | 3.148071 | 0.556641 | 5 | 10 | 5 | 0.854210 | 1132585 | POINT (-108.08892 39.16668) |
| 2019-11-14 03:46:41.959268352 | -1.415894 | 16 | 2 | 50 | 5 | -43.973728 | 5 | [0.0, 0.0, 0.0, 0.0, 0.0, 0.0, 0.0, 0.0, 0.0, ... | 737 | 1712.941406 | ... | 4.357827e+06 | -3154.295410 | 0.000000 | 0.000000 | 5 | 0 | 5 | NaN | 1132689 | POINT (-108.08898 39.16714) |
2101 rows × 25 columns
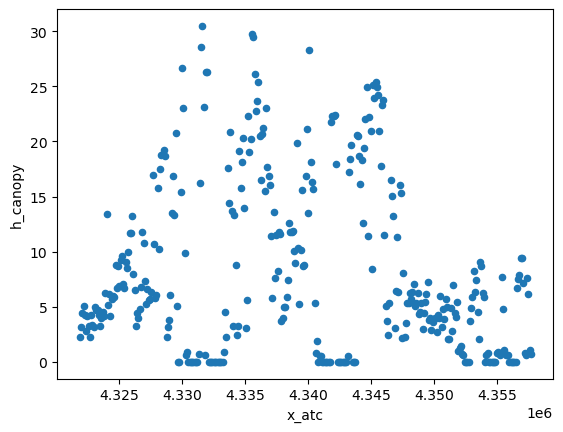
Plot Canopy Height
[6]:
canopy_gt1l = atl08[atl08['gt'] == icesat2.GT1L]
canopy_gt1l.plot.scatter(x='x_atc', y='h_canopy')
[6]:
<Axes: xlabel='x_atc', ylabel='h_canopy'>
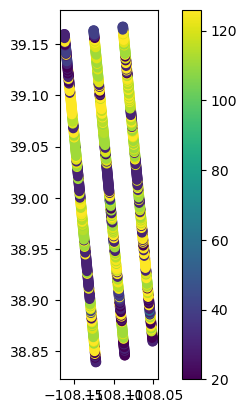
Plot Landcover
[7]:
atl08.plot('landcover', legend=True)
[7]:
<Axes: >
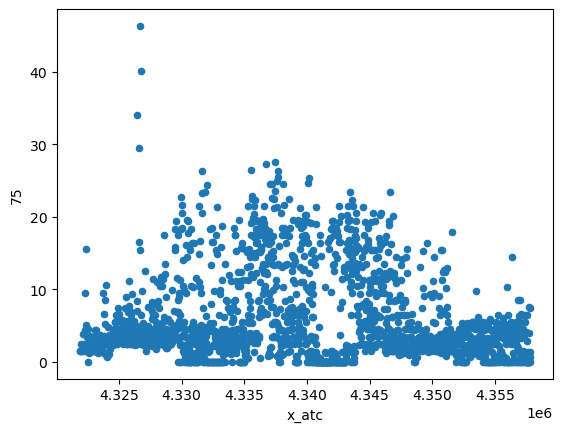
Create and Plot 75th percentile Across All Ground Tracks
[8]:
atl08['75'] = atl08.apply(lambda row : row["canopy_h_metrics"][icesat2.P['75']], axis = 1)
atl08.plot.scatter(x='x_atc', y='75')
[8]:
<Axes: xlabel='x_atc', ylabel='75'>