Using atl03x to get ICESat-2 data over the Boulder Watershed
Process ATL03 data from the Boulder Watershed region and produce a customized ATL06 elevation dataset.
What is demonstrated
The
atl03xAPI is used to process the Boulder Watershed regionThe
matplotlibandgeopandaspackages are used to plot the data returned by SlideRule
Points of interest
This is a simple notebook showing how a region of interest can be processed by SlideRule and the results analyzed using geopandas GeoDataFrames and Matplotlib.
[1]:
import geopandas as gpd
import matplotlib.pyplot as plt
from sliderule import sliderule, icesat2
SlideRule Configuration
[2]:
# Configure Region of Interest
region = [ {"lon":-105.82971551223244, "lat": 39.81983728534918},
           {"lon":-105.30742121965137, "lat": 39.81983728534918},
           {"lon":-105.30742121965137, "lat": 40.164048017973755},
           {"lon":-105.82971551223244, "lat": 40.164048017973755},
           {"lon":-105.82971551223244, "lat": 39.81983728534918} ]
Execute ATL06 Algorithm using SlideRule
[3]:
%%time

# Build ATL06 Request
parms = {
    "poly": region,
    "srt": icesat2.SRT_LAND,
    "cnf": icesat2.CNF_SURFACE_HIGH,
    "ats": 10.0,
    "cnt": 10,
    "len": 40.0,
    "res": 20.0,
    "fit": {}
}

# Request ATL06 Data
gdf = sliderule.run("atl03x", parms)

# Display Statistics
print("Reference Ground Tracks: {}".format(gdf["rgt"].unique()))
print("Cycles: {}".format(gdf["cycle"].unique()))
print("Received {} elevations".format(len(gdf)))
Exception <-1>: Failure on resource ATL03_20240321233614_00512302_006_01.h5 beam gt3r: H5Coro::Future read failure on gt3r/heights/dist_ph_along
Reference Ground Tracks: [531  28 554  51 996 973]
Cycles: [24 18 10 25 21  9 12 19  4 20 22 16 15  6  5  8 13 23  1  2 17  7 14 11
 26  3]
Received 398866 elevations
CPU times: user 923 ms, sys: 303 ms, total: 1.23 s
Wall time: 50.7 s
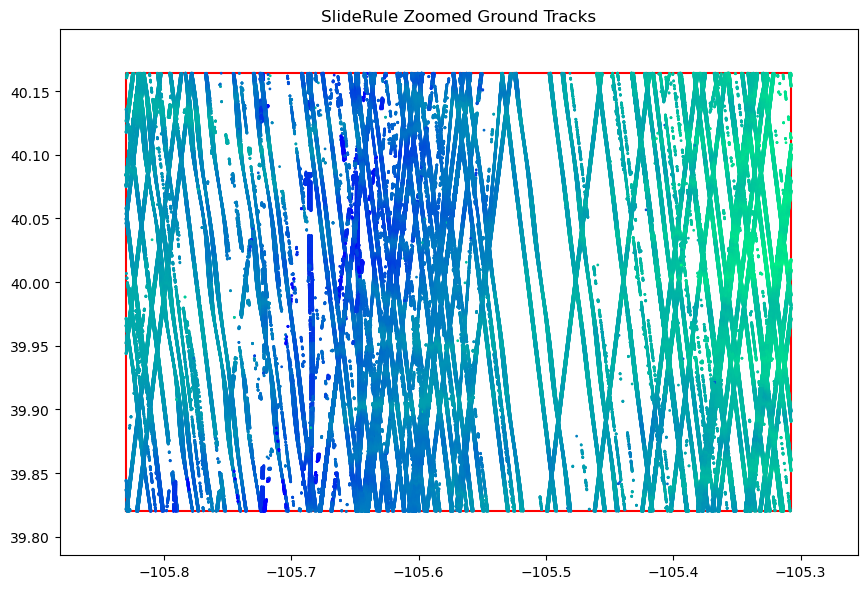
Plot Region
[4]:
# Calculate Extent
lons = [p["lon"] for p in region]
lats = [p["lat"] for p in region]
lon_margin = (max(lons) - min(lons)) * 0.1
lat_margin = (max(lats) - min(lats)) * 0.1

# Create Plot
fig,ax = plt.subplots(num=None, ncols=1, figsize=(12, 6))
box_lon = [e["lon"] for e in region]
box_lat = [e["lat"] for e in region]

# Plot SlideRule Ground Tracks
ax.set_title("SlideRule Zoomed Ground Tracks")
gdf.plot(ax=ax, column=gdf["h_mean"], cmap='winter_r', s=1.0, zorder=3)
ax.plot(box_lon, box_lat, linewidth=1.5, color='r', zorder=2)
ax.set_xlim(min(lons) - lon_margin, max(lons) + lon_margin)
ax.set_ylim(min(lats) - lat_margin, max(lats) + lat_margin)
ax.set_aspect('equal', adjustable='box')

# Show Plot
plt.tight_layout()